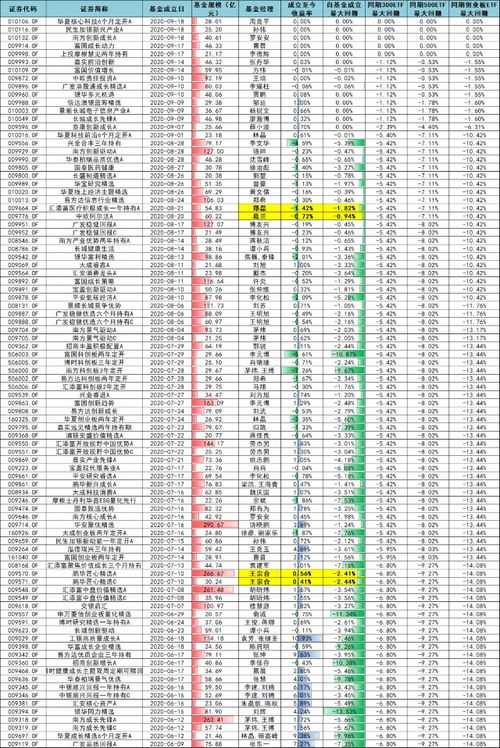
基金最大回撤怎样计算
Title: Understanding and Calculating Maximum Drawdown in Investment Funds
Investment funds are subject to market fluctuations, and understanding the concept of maximum drawdown is crucial for assessing risk and making informed investment decisions. Maximum drawdown refers to the largest peaktotrough decline in the value of a fund's investment over a specific period. Calculating maximum drawdown involves several steps and considerations to ensure accurate risk assessment.
1. Definition of Maximum Drawdown:
Maximum drawdown represents the largest percentage decline in the net asset value (NAV) of an investment from its peak value to its lowest point before a new peak is achieved. It is a measure of the downside risk of an investment, indicating the extent of potential losses investors may incur during adverse market conditions.
2. Importance of Maximum Drawdown:
Understanding maximum drawdown is essential for investors to evaluate the risk associated with an investment fund accurately. It provides insights into the historical downside volatility and helps investors assess the potential magnitude of losses during market downturns. By considering maximum drawdown alongside other risk metrics, investors can construct a wellbalanced portfolio aligned with their risk tolerance and investment objectives.
3. Calculation Method:
The calculation of maximum drawdown involves the following steps:
Step 1: Identify Peak and Trough Points:
Identify the highest NAV (peak) and the lowest NAV (trough) during the specified period.
The peak represents the highest point of the fund's value before a significant decline, while the trough is the lowest point reached during that decline.
Step 2: Calculate Drawdown for Each Peak:
For each peak, calculate the drawdown by subtracting the trough value from the peak value.
Drawdown = (Peak Value Trough Value) / Peak Value
Step 3: Determine Maximum Drawdown:
Identify the largest drawdown value obtained from all the peaktotrough declines calculated.
This value represents the maximum drawdown for the specified period.
4. Example Calculation:
Let's consider an investment fund with the following NAV values over a specific period:
Peak NAV: $1,200

Trough NAV: $800
Using the formula:
Drawdown = (Peak Value Trough Value) / Peak Value
Drawdown = ($1,200 $800) / $1,200
Drawdown = $400 / $1,200
Drawdown = 0.3333 or 33.33%
In this example, the drawdown is 33.33%.
5. Interpretation and Implications:
A maximum drawdown of 33.33% indicates that the fund's value declined by 33.33% from its peak before reaching a new high. Investors should interpret this figure in the context of their risk tolerance and investment objectives. A higher maximum drawdown implies higher downside risk and volatility, while a lower drawdown suggests a more stable investment.
6. Risk Management Strategies:
Understanding maximum drawdown enables investors to implement risk management strategies to mitigate potential losses:
Diversification: Invest in a diversified portfolio across different asset classes to reduce concentration risk.
Stoploss Orders: Set predefined stoploss levels to automatically sell a fund when it reaches a certain drawdown threshold, limiting potential losses.
Asset Allocation: Allocate assets based on risk tolerance, investment horizon, and market conditions to achieve a balanced portfolio.
Conclusion:
Maximum drawdown is a crucial risk metric that helps investors assess the downside potential of investment funds. By understanding how to calculate and interpret maximum drawdown, investors can make informed decisions, manage risk effectively, and achieve their longterm financial goals.
References:
Investopedia. "Maximum Drawdown (MDD)." [Link](https://www.investopedia.com/terms/m/maximumdrawdownmdd.asp)
CFA Institute. "Understanding Maximum Drawdown." [Link](https://www.cfainstitute.org/en/membership/professionaldevelopment/refresherreadings/2021/understandingmaximumdrawdown)
股市动态
MORE>- 搜索
- 最近发表
-
- 探索中融人寿,您的家庭财富守护者
- 探索沧州大化吧,一个化工爱好者的线上乐园
- 平安最好的意外险,为您的明天保驾护航
- 股票000002,探索万科A的奥秘,投资路上的明灯
- 守护未来,深入了解中国平安养老保险
- 深入解析滨江集团股票,投资价值、市场表现与未来展望
- 工银新材料新能源,引领绿色革命的先锋力量
- 沪农商行股票投资分析,未来涨幅预测与投资策略
- 宏利人寿,您的财富守护者与未来规划师
- 远期外汇交易,解锁全球贸易的金融钥匙
- 沈阳医保二次报销,守护健康,减轻负担的双重盾牌
- 恒马金融,金融科技的创新先锋
- 百股跌停,股市风暴中的黑色星期五
- 上海医药集团,健康生活的守护者
- 银华金利,探索中国金融创新的璀璨明珠
- 美元汇率查询,掌握全球经济脉搏,洞察投资先机
- 木林森股份,探索中国LED照明行业的领军企业
- 股票300142,探秘沃森生物,解锁生物科技的财富密码
- 柳钢股份股吧,投资者的交流平台与信息宝库
- 通化金马股吧,投资者的交流平台与信息集散地


